Longevity Calculator Guide. What Affects Life Expectancy Inputs
Longevity Calculator Guide: It usually begins quietly.
- Maybe it is a birthday that feels heavier than usual.
- Maybe it is a medical result.
- Maybe it is a conversation about retirement.
At some point, most of us wonder how long we might live.
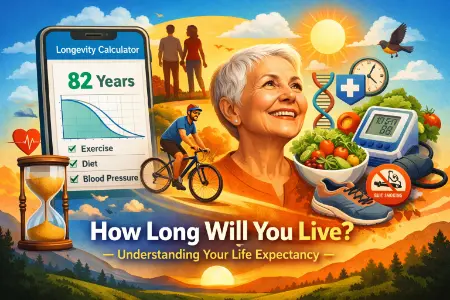
If you are here because that question feels personal, you are not alone. This Longevity calculator guide will not predict your death. It will help you understand what the numbers mean and where you actually have control. If you want a quick projection first, you can try our longevity calculator tool. Then come back here and understand what shapes that result.
What a Longevity Calculator Really Measures
A longevity calculator does not see your future. It estimates statistical risk based on patterns from large populations.
It starts with life tables. These are datasets showing how long groups of people live. In the United States, many models align with Social Security life expectancy tables. Globally, many rely on World Health Organization mortality data.
- That starting point reflects population life expectancy, not your personal destiny.
- Then your inputs adjust that baseline. The result becomes a survival probability curve. That curve shows your statistical chance of reaching future ages.
- Average life expectancy means the arithmetic average.
- Median life expectancy means half of similar people live longer and half live shorter.
Quick takeaway about Longevity Calculator Guide
- The number is a probability
- The curve matters more than a single age
- Your habits shift risk over time
Healthspan versus lifespan
- Lifespan measures total years lived.
- Health span measures years lived in good health.
Most calculators focus on lifespan. Few adjust for health adjusted life expectancy. That matters for quality of life planning.
The Core Inputs That Shape Your Estimate
Every model begins with age and gender input. This sets your baseline using either period life expectancy tables or cohort life expectancy tables.
Period tables use current mortality patterns.
Cohort tables adjust for birth year and expected future mortality improvements.
This modeling choice alone can shift projections by several years. That is one reason why life expectancy calculators differ.
Next comes body composition.
Height and weight input generate BMI. Long term studies such as the Framingham Heart Study show links between BMI and life expectancy through cardiovascular risk patterns. However, BMI has limits. Muscular individuals can appear high risk despite strong metabolic health.
That is why no single metric tells the whole story.
Quick clarity
- Age sets the baseline
- Body metrics adjust metabolic risk
- Dataset selection influences output
Lifestyle Factors That Move the Curve the Most
Lifestyle factors often move projections more than genetics.
Smoking
The smoking impact on life expectancy is one of the strongest risk multipliers in public health research. If you smoke and you are reading this, this is not judgment. Data shows quitting at almost any age improves long term survival probability.
Alcohol
Alcohol consumption and lifespan follow a dose relationship. Heavy drinking increases mortality risk across multiple systems.
Physical activity
Exercise and longevity show consistent positive association. A higher physical activity level improves insulin sensitivity, vascular health, and inflammation markers.
Diet
Diet quality and lifespan are closely linked. Balanced nutrition and longevity patterns reduce chronic disease risk over time.
Sleep
Sleep duration and lifespan connect through hormone regulation and immune function.
Stress
Stress and life expectancy interact through both biology and daily behavior.
A real example
One reader, 52 years old, stopped smoking, reduced blood pressure through medication and walking, and improved sleep consistency. His projected survival estimate shifted upward by four years. Not guaranteed years. Shifted probability.
Medical and Biological Inputs That Carry Heavy Weight
Once chronic disease enters the picture, risk compounds.
Chronic disease impact on lifespan becomes significant with diabetes and life expectancy data, heart disease and longevity patterns, blood pressure and lifespan correlations, and cholesterol levels and longevity risk.
- High blood pressure often shows no symptoms. Yet it strongly predicts stroke and heart disease.
- Diabetes increases long term vascular damage.
- Multiple conditions amplify mortality risk more than people expect.
- Doctor visits frequency also matters. Preventive care increases early detection and often improves long term outcomes.
The Social and Environmental Factors Many Tools Miss
Health is not just biology.
- Access to care, income stability, education level, neighborhood safety, and clean air influence population life expectancy.
- Social connections and longevity research show that people with stronger community ties often live longer.
- Mental health and longevity connect through sleep, adherence to care, and daily habits.
- Isolation quietly increases stress load.
If you want to improve sleep or stress management, our stress and sleep guide explains practical first steps.
How Longevity Calculators Actually Calculate Results
You are probably wondering whether you can trust the number.
Fair question.
Here is how longevity calculators work in simple terms.
- They begin with baseline life tables.
- They apply risk multipliers based on inputs like smoking, BMI, blood pressure, diabetes, and activity level.
- Those multipliers come from large cohort studies and actuarial research.
The final output is a probability distribution. Many tools display one age for simplicity. Behind that number sits a survival curve.
Understanding that reduces fear. It turns the result into guidance.
How Accurate Are Longevity Calculators
- No calculator predicts exact outcomes.
- Basic tools using only age and sex mostly reflect public averages.
- More advanced tools incorporate medical conditions and life expectancy patterns, improving risk differentiation.
- However, limitations of longevity calculators include dataset bias, underrepresentation of certain populations, and unpredictable events.
- Future mortality improvements from medical advances may extend projections beyond current expectations.
Use the estimate as a planning lens, not a prophecy.
How to Use Your Result the Smart Way
- Check your blood pressure this week.
- Schedule a routine exam if overdue.
- Track sleep for seven days.
- Walk 20 minutes daily.
Small consistent changes compound.
Retirement planning life expectancy affects retirement duration planning and annuity life expectancy calculations. Insurance underwriting life expectancy models rely on similar principles.
- Planning for living longer than average protects your financial stability.
- The healthiest mindset is this Improve what you can control.
- Accept uncertainty where you cannot.
Longevity Calculator Guide: Limitations You Should Understand
Individual vs population estimates remain misunderstood. A calculator reflects statistical patterns, not personal destiny.
- It cannot predict accidents.
- It cannot account for unknown future therapies.
- It cannot measure resilience.
Good longevity research acknowledges uncertainty while focusing on modifiable risk.
Our medical disclaimer explains this in more detail.
Longevity Calculator Guide: When a Longevity Calculator Is Worth Using
- You want structured insight into risk
- You are planning retirement
- You are reviewing insurance
- You want motivation for lifestyle improvement
- It is less useful when used obsessively.
If you feel anxious after seeing a projection, pause. Improve one habit for eight weeks. Then reassess.
That creates measurable movement in survival probability.
Quick Impact Summary
| Factor | Typical Impact | Why It Matters |
|---|---|---|
| Smoking | Very High | Strong cancer and vascular multiplier |
| Blood Pressure | High | Stroke and heart disease pathway |
| Diabetes | High | Systemic metabolic damage |
| Activity Level | Moderate to High | Improves cardiovascular resilience |
| Sleep and Stress | Moderate | Hormonal and behavioral effects |
| Family History | Variable | Genetic sensitivity, not destiny |